The refinance boom that shaped the last decade of household borrowing has effectively ended, and the numbers behind consumer behavior now show what replaced it.
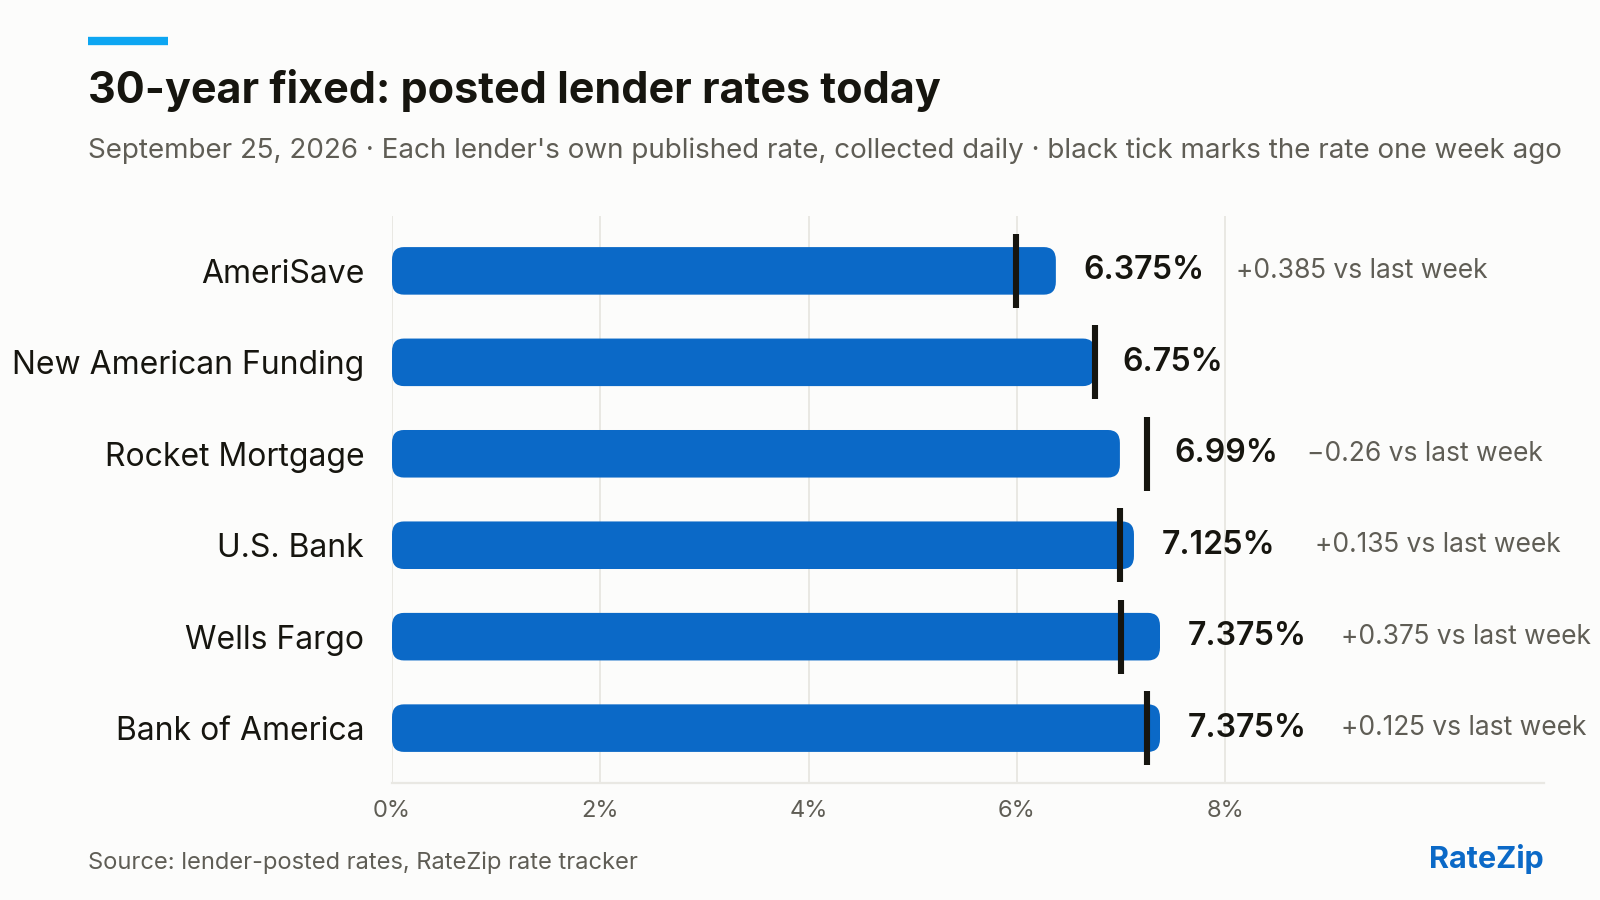
Chart: RateZip · Source: lender-posted rates tracked daily by RateZip.
Over the three months through August 2026, home-equity products — HELOCs plus reverse mortgages — drew 76% of the mortgage inquiries consumers submitted across our network, according to RateZip's Mortgage Demand Index. A year earlier, in the same months, that share was 43%. Refinance went the other direction, from 39% of the mix to 2%.
That is not a small rotation. It is borrowers treating their existing mortgage as untouchable and reaching for the equity around it instead.
Why 7% changes the math
The rate backdrop explains what borrowers are reacting to. Freddie Mac's weekly survey put the national average 30-year fixed at 7.03% in the week ending September 24, up from 6.95% a week earlier. The 10-year Treasury yield, the benchmark long-term mortgage pricing most closely tracks, closed Wednesday at 5.11%, up 15 basis points from the prior close.
Asked how long this level might persist, Lawrence Yun, chief economist at the National Association of REALTORS®, has been blunt in a statement on what such rates could mean for buyers: "Expect 7% as the new normal."
Mike Fratantoni, chief economist at the Mortgage Bankers Association, described the recent move in a September 23 statement: "Mortgage rates vaulted higher last week, with the 30-year fixed rate at 7.12% — the highest level since May 2024."
Demand for mortgage credit has not disappeared, though. Total inquiry volume in August ran 11% above July's and 157% above August 2025's. The appetite is there; the product mix has shifted.
What lenders are posting
Friday's posted rates show how uneven pricing has become. The spread between the cheapest and most expensive 30-year fixed in the tracked set is a full point — AmeriSave at 6.375% against Bank of America at 7.375% — worth roughly $267 a month on a $400,000 loan. On any given morning, the gap between lenders is far larger than the day-to-day movement of any one of them.
Direction varies too. Rocket Mortgage cut its 30-year fixed to 6.99%, its second cut in the past three weeks, leaving that product down 0.115 points over the stretch. AmeriSave moved the other way on the same product, adding 0.25.
The buyer side of it
For people still shopping, affordability improved only marginally. MBA's Purchase Applications Payment Index eased 0.6% to 154.3 in August as the median purchase-applicant payment slipped to $2,162, an improvement MBA attributed mainly to smaller loan amounts — with 27 states still worsening.
Builders are feeling it. The NAHB/Wells Fargo Housing Market Index fell three points to 32 in September, its weakest reading since September 2025, with builders citing material costs, labor, tight lending and expanding use of incentives and price cuts. New single-family homes sold at a 684,000 annual rate in August against an 8.5-month supply.
If Yun's forecast holds, the equity-over-refinance pattern in the demand data is less a moment than a baseline.
Today's posted rates: the full table
| Lender | 30-Yr | 15-Yr | 20-Yr | FHA 30-Yr | VA 30-Yr | Jumbo 30-Yr | 7/6 ARM | HELOC |
|---|---|---|---|---|---|---|---|---|
| AmeriSave | 6.375% / 6.858% (+0.25) | 5.5% / 6.334% (+0.25) | — | — | — | — | — | — |
| New American Funding | 6.75% / 6.866% | 6.125% / 6.316% | — | 6.25% / 7.287% | 6.375% / 6.806% | — | — | — |
| Rocket Mortgage | 6.99% / 7.889% (−0.385) | 6.875% / 7.35% (+0.25) | — | — | — | — | — | — |
| Wells Fargo | 7.375% / 7.527% (+0.125) | 6.625% / 6.884% | — | — | 6.75% / 6.986% (+0.125) | — | 6.875% / 6.869% (−0.125) | — |
| U.S. Bank | 7.125% / 7.301% | 6.5% / 6.795% | 7.125% / 7.302% | 7.25% / 8.145% | 6.99% / 7.364% | 7.25% / 7.425% | 7.25% / 7.191% | — |
| Bank of America | 7.375% / 7.632% | 6.625% / 7.009% | 7.375% / 7.683% (+0.125) | — | — | — | 6.625% / 6.79% | — |
| Veterans United | — | — | — | — | 6.875% / 7.358% (+0.25) | — | — | — |
| FourLeaf Federal Credit Union | — | — | — | — | — | — | — | 7% / 7% |
Rates are each lender's own published rate as of 9:50 a.m. ET, collected from their public rate pages and feeds. The APR is the better cross-lender comparison; a figure in parentheses is today's change; a '—' means the lender doesn't post that product. How we collect and publish this: our rate methodology.
Source: Freddie Mac Primary Mortgage Market Survey via FRED®, Federal Reserve Bank of St. Louis.