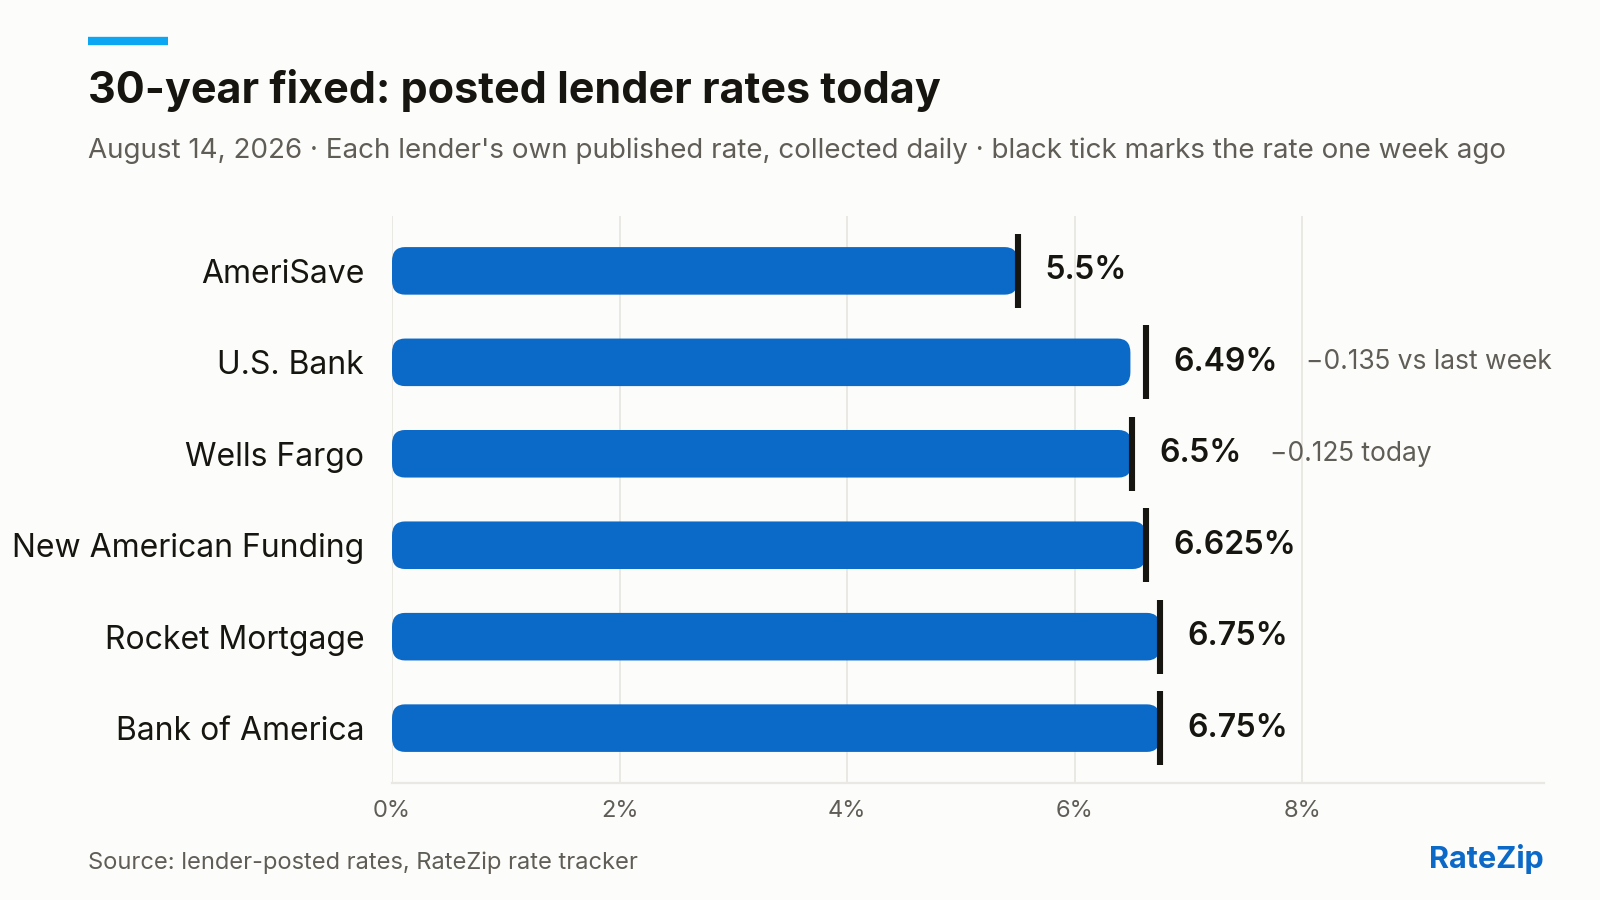
Posted rates moved on Friday: U.S. Bank 30-Year Fixed to 6.49% (−0.135), Wells Fargo 30-Year Fixed to 6.5% (−0.125), Bank of America 15-Year Fixed to 5.875% (−0.125), Bank of America 20-Year Fixed to 6.5% (−0.125), and 5 more posted rates. The full table and the 30-day trend are below.
| Lender | 30-Yr | 15-Yr | 20-Yr | FHA 30-Yr | VA 30-Yr | Jumbo 30-Yr | 7/6 ARM | HELOC |
|---|---|---|---|---|---|---|---|---|
| AmeriSave | 5.5% / 5.992% | 4.625% / 5.467% | — | — | — | — | — | — |
| New American Funding | 6.625% / 6.74% | 6.125% / 6.316% | — | 6.25% / 7.287% | 6.25% / 6.681% | — | — | — |
| Rocket Mortgage | 6.75% / 7.014% | 5.875% / 6.33% | — | — | — | — | — | — |
| Wells Fargo | 6.5% / 6.669% (−0.125) | 5.875% / 6.107% | — | — | 5.875% / 6.11% (−0.125) | — | 6.25% / 6.465% | — |
| U.S. Bank | 6.49% / 6.666% (−0.135) | 5.875% / 6.139% | 6.125% / 6.332% | 6.5% / 7.398% (−0.125) | 6.25% / 6.608% | 6.875% / 7.03% | 6.125% / 6.41% | — |
| Bank of America | 6.75% / 6.978% | 5.875% / 6.266% (−0.125) | 6.5% / 6.817% (−0.125) | — | — | — | 6% / 6.408% (−0.125) | — |
| Veterans United | — | — | — | — | 5.875% / 6.307% | — | — | — |
| FourLeaf Federal Credit Union | — | — | — | — | — | — | — | 6.75% / 6.75% |
Rates are each lender's own published rate as of 9:50 a.m. ET, collected from their public rate pages and feeds. Each cell shows the posted rate / APR — the APR is the better cross-lender comparison, since posted rates reflect each lender's own assumptions about credit, points, and loan size. A figure in parentheses is today's change; a '—' means the lender doesn't post that product.
AmeriSave also posts refinance pricing: 30-year fixed at 5.875% (6.388% APR), −0.115 today and 15-year fixed at 5.125% (5.991% APR), −0.125 today.
The gap between the cheapest and most expensive posted 30-year rate in our tracked set is 1.25 points (AmeriSave at 5.5% vs Rocket Mortgage at 6.75%). On a $400,000 loan that spread is about $323 a month — on any given morning, the difference between lenders is far larger than the day-to-day movement of any one of them.
Over the past week the biggest move in the set is U.S. Bank's posted 20-Year Fixed, down 0.25 points.
In the broader market, the 10-year Treasury yield — the benchmark long-term mortgage pricing most closely tracks — stood at 4.68% at its most recent close (Wednesday, August 12, per FRED), down 2 basis points from the prior close and up 5 basis points over the past week. That is not a move that repriced the market: there is no clear macro driver behind today's posted-rate changes, and day-to-day adjustments of this size are routine lender-level pricing.
Where borrower demand is heading: RateZip's Mortgage Demand Index — built from the mortgage inquiries consumers submit across our network — shows July 2026 inquiry volume 13% lower than June 2026's and 45% higher than July 2025's. Behind the total: home-equity products (HELOC plus reverse) drew 77% of inquiries over the three months through July 2026, versus 25% in the same months a year earlier; refinance went from 46% to 1% of the mix. Product-level detail and the full series are on the index page.