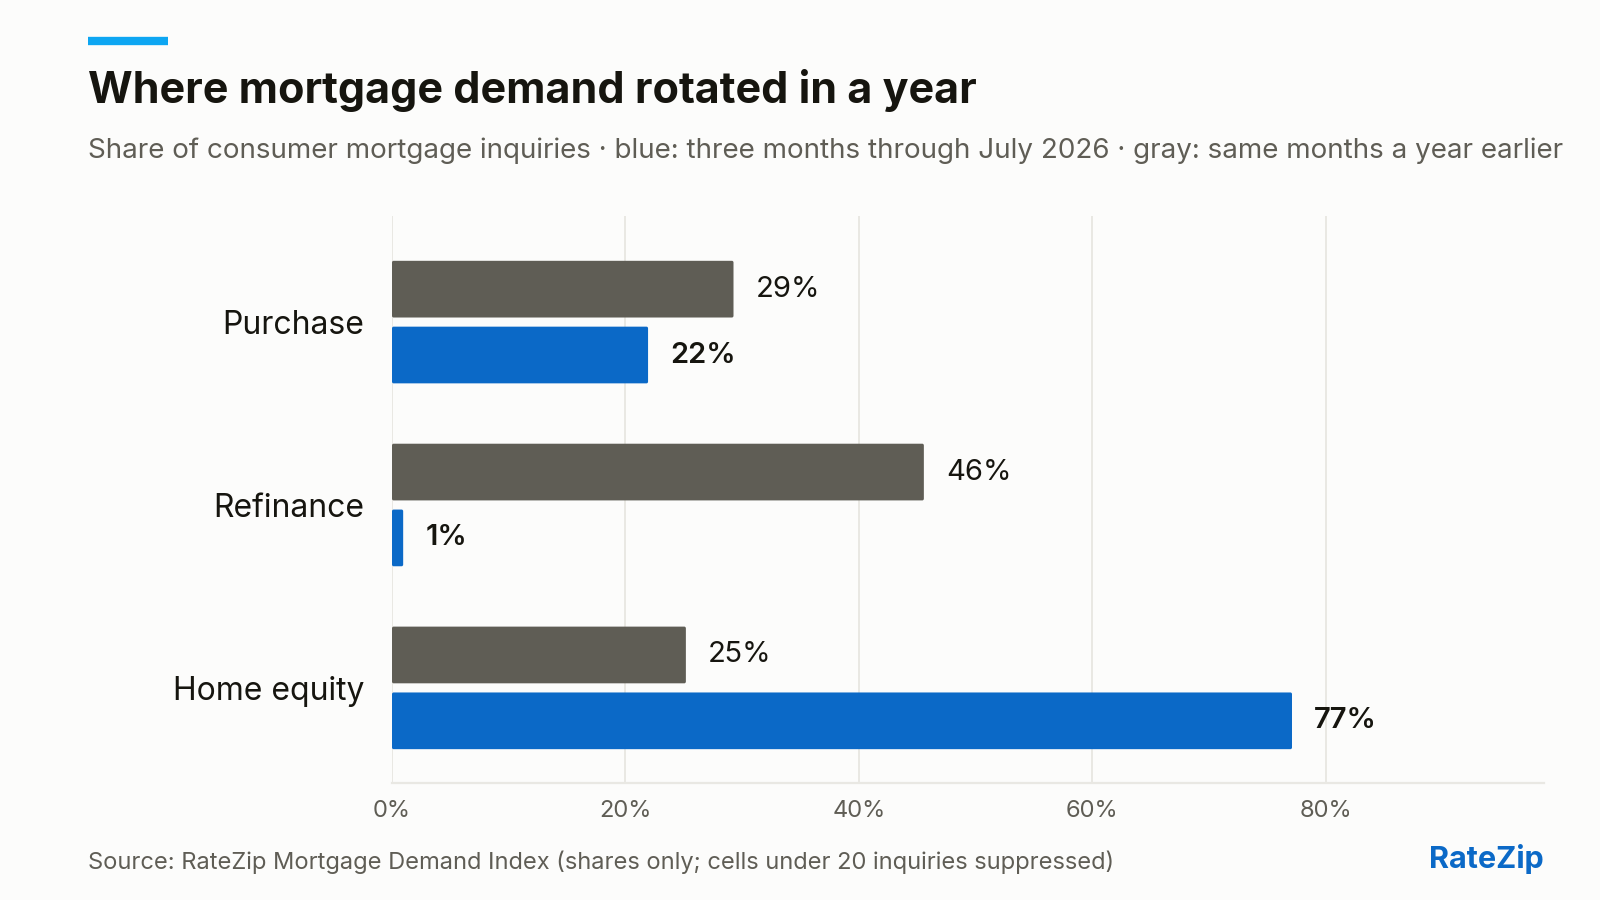
A year ago, home-equity products accounted for 25% of the mortgage demand consumers brought to RateZip's network. Over the three months through July 2026, that figure was 77%. The customers walking through the door have changed — this is what the turn looks like in our own data, as of August 13, 2026.
Where the demand went
Across the three months through July 2026, the mix of mortgage inquiries submitted across RateZip's network was: purchase 22% (down from 29%); refinance 1% (down from 46%); home-equity products (HELOCs plus reverse) 77% (up from 25%) — each against the same three months a year earlier. The move of the year: 52 percentage points of the entire inquiry mix rotated toward home-equity products in twelve months.
The Mortgage Demand Index reads in complete months, publishes shares and percent changes only — never inquiry counts — and suppresses any product-month with fewer than 20 inquiries. Comparisons that suppression could distort by more than 3% are dropped from this story rather than approximated. The full series back to 2011, product by product, is on the index page.
One note on the data: the inquiry series changed source systems between the two windows compared here (completed March 2026); the boundary and how it is handled are documented on the Mortgage Demand Index page.
The spread nobody quotes
As of Thursday's readings, the cheapest posted 30-year fixed rate in RateZip's tracked set is AmeriSave's 5.5%; the most expensive is Rocket Mortgage's 6.75% — a spread of 1.25 points. On a $400,000 loan, that gap is about $323 a month between asking the right lender and the wrong one.
Measured only across lenders present at both ends of a comparison — a lender joining our tracked set must never read as the market moving — that gap is unchanged from a week earlier (across the 6 lenders posted at both ends). Nobody else publishes this number from this angle: it is the distance between the best and worst deal on the same morning, and most weeks it moves more than any single lender's rate does.
Rates and the 10-year
Posted 30-year rates at the lenders RateZip tracks ended the week within a few thousandths of where they started it. In the broader market, the 10-year Treasury yield — the benchmark long-term mortgage pricing most closely tracks — stood at 4.70% at its most recent close (Tuesday, August 11, per FRED), up 1 basis point from a week earlier. Neither is a move that repriced anything: there is no clear macro driver behind this week's pricing, and drift of this size is routine lender-level adjustment.
Every figure above comes from one of three places: RateZip's Mortgage Demand Index (consumer mortgage inquiries across our network — shares and percent changes only), the lender-posted rates RateZip collects every weekday (the same data behind our daily Mortgage rates today report), or the Federal Reserve's FRED series for the 10-year Treasury yield. RateZip is a licensed mortgage broker (NMLS #1592292); this story describes what borrowers and lenders are doing and is not advice about what any reader should do.