The 8 lenders RateZip tracks left all 27 posted rates we follow unchanged on Monday — the table below shows where every posted product stands, and the week-over-week read follows it.
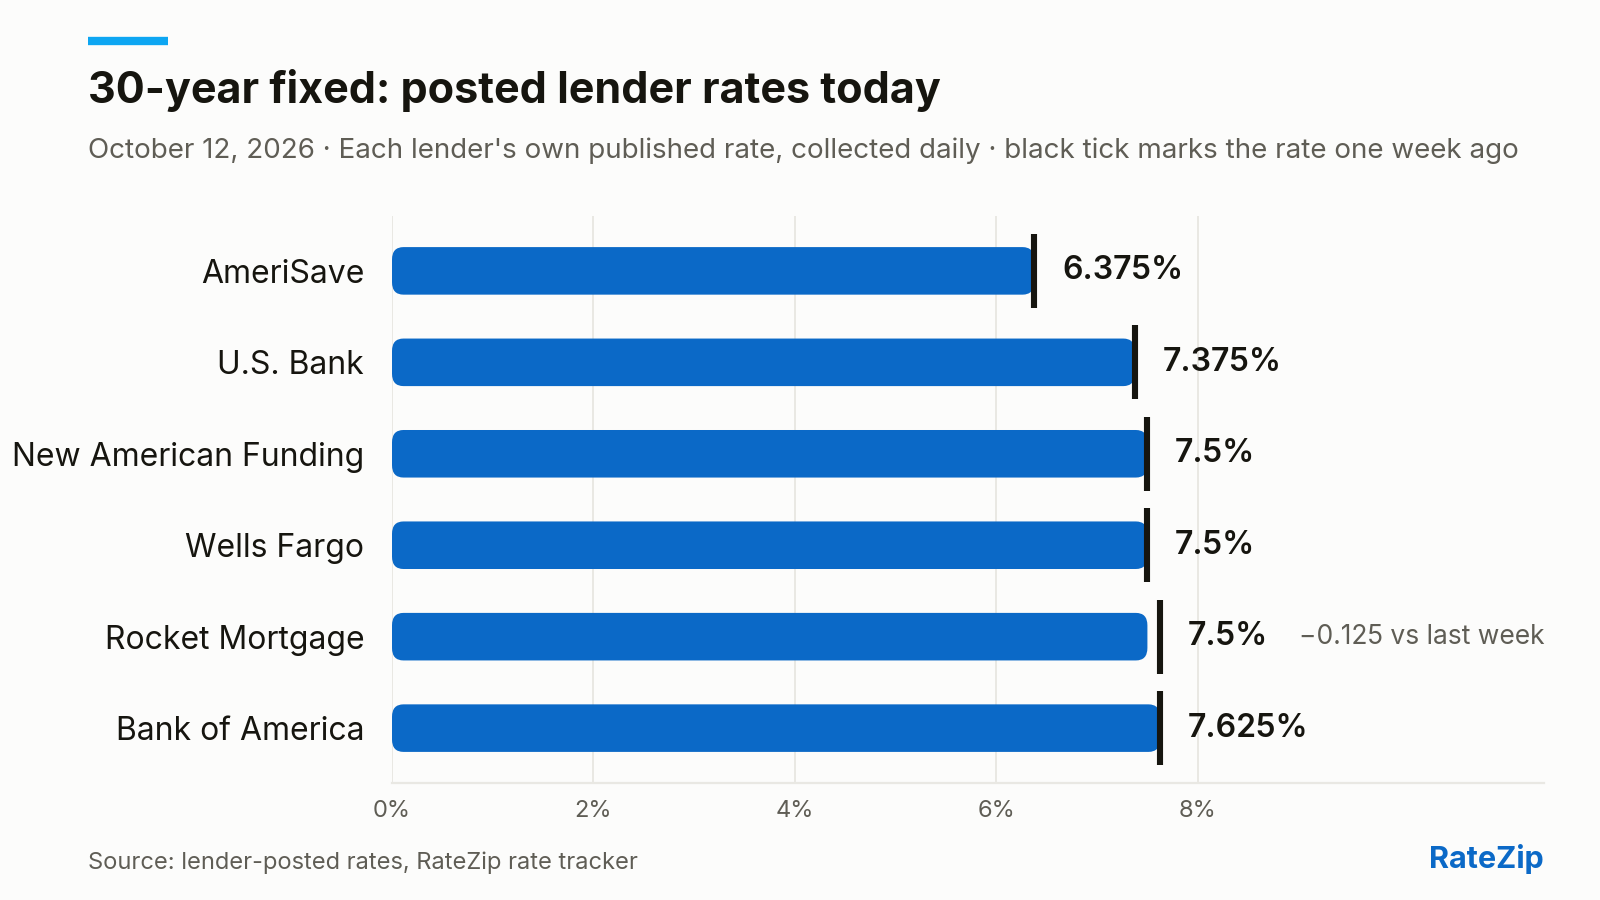
Chart: RateZip · Source: lender-posted rates tracked daily by RateZip.
| Lender | 30-Yr | 15-Yr | 20-Yr | FHA 30-Yr | VA 30-Yr | Jumbo 30-Yr | 7/6 ARM | HELOC |
|---|---|---|---|---|---|---|---|---|
| AmeriSave | 6.375% / 6.836% | 5.375% / 6.242% | — | — | — | — | — | — |
| New American Funding | 7.5% / 7.599% | 7% / 7.195% | — | 7.25% / 8.305% | 7.25% / 7.708% | — | — | — |
| Rocket Mortgage | 7.5% / 7.806% | 6.75% / 7.243% | — | — | — | — | — | — |
| Wells Fargo | 7.5% / 7.666% | 6.75% / 7.008% | — | — | 6.875% / 7.112% | — | 6.75% / 6.802% | — |
| U.S. Bank | 7.375% / 7.553% | 6.75% / 7.051% | 7.25% / 7.493% | 7.625% / 8.548% | 7.25% / 7.629% | 7.5% / 7.677% | 7.25% / 7.162% | — |
| Bank of America | 7.625% / 7.861% | 6.75% / 7.132% | 7.25% / 7.579% | — | — | — | 6.75% / 6.92% | — |
| Veterans United | — | — | — | — | 6.75% / 7.23% | — | — | — |
| FourLeaf Federal Credit Union | — | — | — | — | — | — | — | 7% / 7% |
Rates are each lender's own published rate as of 9:50 a.m. ET, collected from their public rate pages and feeds. Each cell shows the posted rate / APR — the APR is the better cross-lender comparison, since posted rates reflect each lender's own assumptions about credit, points, and loan size. A figure in parentheses is today's change; a '—' means the lender doesn't post that product. How we collect and publish this: our rate methodology.
AmeriSave also posts refinance pricing: 30-year fixed at 6.75% (7.228% APR) and 15-year fixed at 5.99% (6.827% APR).
The gap between the cheapest and most expensive posted 30-year rate in our tracked set is 1.25 points (AmeriSave at 6.375% vs Bank of America at 7.625%). On a $400,000 loan that spread is about $336 a month — on any given morning, the difference between lenders is far larger than the day-to-day movement of any one of them.
Over the past week the biggest move in the set is Bank of America's posted 20-Year Fixed, down 0.25 points.
Nationally, Freddie Mac's Primary Mortgage Market Survey put the average 30-year fixed mortgage rate at 7.40% in the week ending October 8, 2026, up from 7.28% a week earlier — the highest since November 2023. Source: Freddie Mac Primary Mortgage Market Survey via FRED®, Federal Reserve Bank of St. Louis.
Payment illustration, not an actual borrower or offer: a $400,000 30-year fixed loan at 7.40% has monthly principal and interest of $2,769.52, compared with $2,736.85 at 7.28%, a difference of $32.67 (higher). Calculated on the same loan amount and term; excludes taxes, insurance, mortgage insurance, points, fees and closing costs. The benchmark is an interest-rate average, not APR or a personalized rate quote.
In the broader market, the 10-year Treasury yield — the benchmark long-term mortgage pricing most closely tracks — stood at 5.22% at its most recent close (Thursday, October 8, per FRED), down 6 basis points from the prior close and down 2 basis points over the past week.
Where borrower demand is heading: RateZip's Mortgage Demand Index — built from the mortgage inquiries consumers submit across our network — shows September 2026 inquiry volume 4% lower than August 2026's and 99% higher than September 2025's. Behind the total: home-equity products (HELOC plus reverse) drew 90% of inquiries over the three months through September 2026, versus 72% in the same months a year earlier; refinance went from 11% to 1% of the mix. Product-level detail and the full series are on the index page.