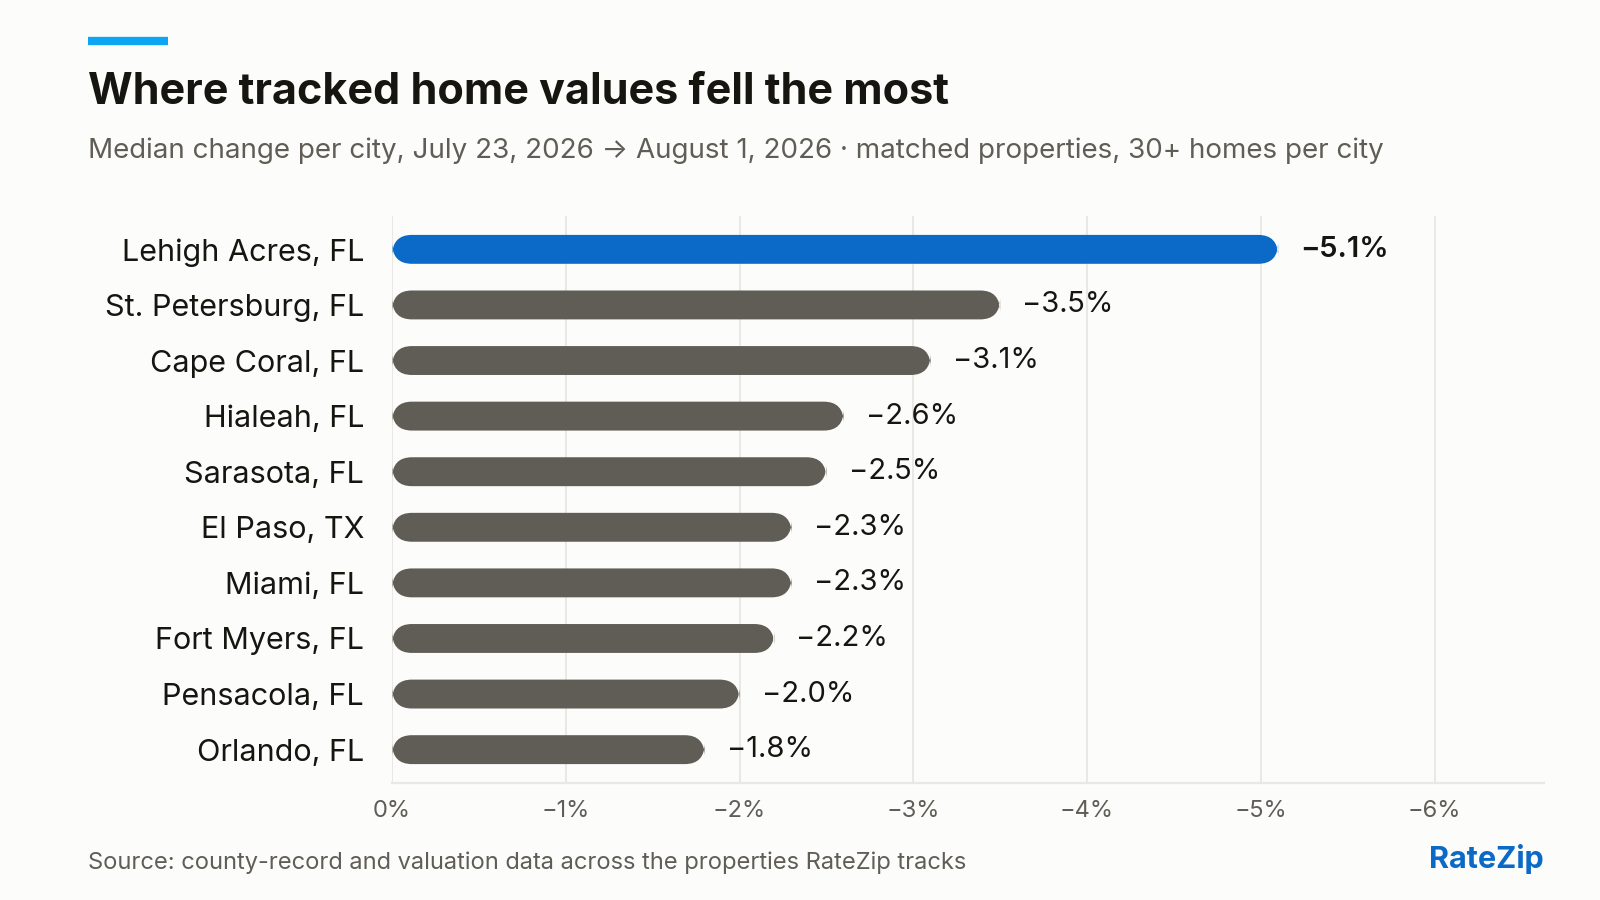
The median tracked home value in Lehigh Acres, FL fell 5.1% between July 23, 2026 and August 1, 2026 — the largest move, in either direction, across the 101 cities where RateZip tracks enough homes to publish. It is not alone: 9 of the 10 biggest declines this edition are Florida cities — St. Petersburg at −3.5%; Cape Coral at −3.1%; Hialeah at −2.6%.
The map of the move
The whole decline tail runs from −5.1% at the top to −1.8% at Orlando, FL. The other side of the ledger is quieter: the largest gain anywhere in the tracked set is Spokane, WA at +1.0%, and that tail is spread across 9 states rather than clustered in one.
What's behind it — in others' reporting
The move above is RateZip's own data. The context below is drawn from public reporting and data sources, each linked — read the originals; they are the authority on the why.
- A July market update reported about seven months of single-family home supply in Lehigh Acres and Fort Myers, compared with six months in Cape Coral. (Sposen Homes, July 8, 2026)
- The same update reported that Lee County home sales and dollar volume rose 14% year over year, while cash sales increased 21% and represented about 45% of transactions. (Sposen Homes, July 8, 2026)
- Federal Reserve data show 2,074 new listings in the Cape Coral–Fort Myers metro during June 2026 on a non-seasonally-adjusted basis. (Federal Reserve Bank of St. Louis)
- A builder market update, refreshed in July 2026, reports about 10,575 active listings in the Cape Coral–Fort Myers metro as of June 2026 — roughly a seven-month supply. (M/I Homes, updated July 2026)
- HouseCanary reported 118,603 active Florida listings in the first quarter of 2026 and a median 84 days on market, up from 68 days a year earlier. (HouseCanary, May 14, 2026)
The longer arc
The refresh-over-refresh move above is the short axis. The tracked set carries a long one too: every property's recorded purchase against its estimated value today. Across every city RateZip tracks, the same cohort — homes bought in 2022 or later — is worth 5.1% more than its owners paid at the median, with 33% estimated below purchase.
What borrowers are doing
Nationally, borrowers are already answering: home-equity products drew 77% of the mortgage inquiries consumers brought to RateZip's network over the three months through July 2026, versus 25% in the same months a year earlier — the full picture is on the Mortgage Demand Index.
The figures above are the median percent change in estimated home value across the properties RateZip tracks in each city, matched property-by-property between July 23, 2026 and August 1, 2026 — county-record and valuation data across the properties RateZip tracks; a city is ranked only with a sufficient tracked-property sample (30+ homes), and medians and percentages only are published. Full tables and methodology: Home Value Movers. RateZip is a licensed mortgage broker (NMLS #1592292); this story describes what the data and the linked reporting show and is not advice about what any reader should do.