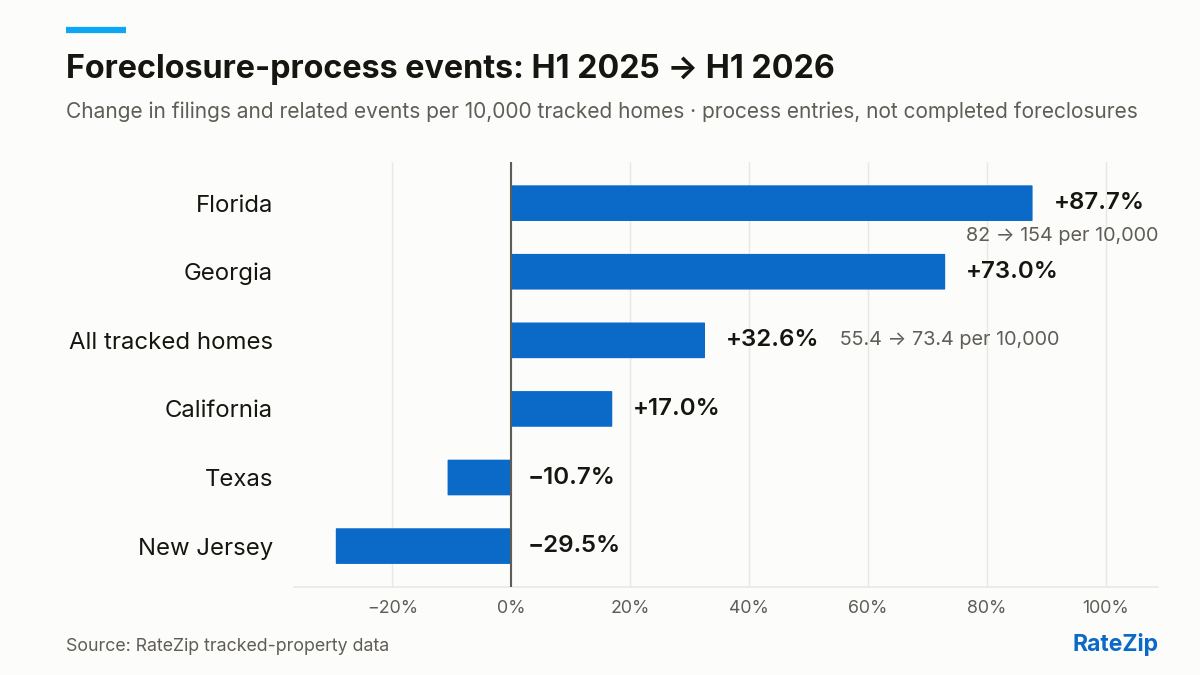
Foreclosure-process events across RateZip's tracked homes rose 32.6% in the first half of 2026 versus a year earlier — from 55.4 to 73.4 events per 10,000 tracked homes. Florida climbed 87.7% and Georgia 73%, while Texas and New Jersey declined. June 2026 was the heaviest single month in our two-and-a-half-year series.
What we count — and what we don't
First, precision about the words, because foreclosure coverage is a place where words slide. A home "enters the foreclosure process" in our data when a foreclosure filing or related event — a notice of default, a lis pendens, a scheduled auction notice — is first recorded against a tracked property in county records. That is the beginning of a process, not the end of one: many of these homes cure the default, sell, or refinance long before any completed foreclosure, and nothing in this report counts completed foreclosures.
It is also worth keeping the absolute level in view. 73.4 events per 10,000 tracked homes in a half-year is still well under 1% of the homes we track. The story here is the direction and the geography, not a wave.
| State | Foreclosure-process events per 10,000 tracked homes, H1 2025 → H1 2026 |
|---|---|
| Florida | +87.7% (82 → 154) |
| Georgia | +73% |
| California | +17% |
| Texas | −10.7% |
| New Jersey | −29.5% |
| All tracked homes | +32.6% (55.4 → 73.4) |
Florida stands out on every axis
Florida nearly doubled, it now runs at more than twice the tracked-set-wide rate — 154 events per 10,000 tracked homes against 73.4 — and it is the same state where tracked home values are falling fastest. In the August edition of our Home Value Movers data page, Florida cities took 9 of the 10 largest city-level declines in median tracked value, led by Lehigh Acres at −5.1% over the edition's window; only West Palm Beach cracked the gains side.
Those two facts feed each other, and the mechanism is equity. A homeowner in trouble in a rising market usually has a third option between curing and filing: sell, pay the loan off, and walk away with something. As local values soften, that exit narrows — the homeowner in trouble with equity sells; the homeowner in trouble without it gets a filing. Watching foreclosure-process entries climb fastest exactly where tracked values are falling fastest is the pattern you would expect if the escape hatch is what's closing.
The declines are just as real as the climbs: Texas foreclosure-process events fell 10.7% and New Jersey's fell 29.5% over the same window. This is not a uniformly deteriorating map — it is a widening split between states, with the tracked-set-wide +32.6% sitting in the middle of a very lopsided distribution.
Who is entering the process: the refinance-era shift
One cohort pattern in our records is striking. Refinance shoppers from 2022–23 have entered the foreclosure process at roughly five times the rate of the 2020–21 refinance cohorts — and much sooner, a median of 13 months from inquiry to first foreclosure-process event, versus 2.9 years for the 2020–21 group.
That is an association, not a causal claim about refinancing. What changed is who was shopping. In 2020–21, refinancing was a windfall pursued by nearly every kind of homeowner, so that cohort looks like the broad tracked population. By 2022–23, with prevailing rates far above most existing mortgages, the homeowners still seeking a refinance skewed heavily toward people who needed cash or payment relief badly enough to consider trading away a low rate. The foreclosure numbers are telling us who was shopping in a high-rate market — not what shopping did to them.
The median timing gap makes the population shift concrete: 13 months from inquiry to first event is not the signature of homeowners who slowly drifted into trouble years later. It is the signature of homeowners who were already stretched when they went shopping.
What we're watching next
June 2026 was the heaviest single month for foreclosure-process events in the two and a half years we have tracked them — the series did not merely drift higher across the half, it accelerated into the end of it. Whether that continues is the thing to watch: a hot single month can be noise in filings data, but a hot month at the end of a climbing half is worth taking seriously.
We will keep reporting the series as it develops, alongside the monthly Home Value Movers refresh — if the equity-exit mechanism is what's driving the split, the value tables and the filing rates should keep moving together, state by state. For the demand side of the same market — which products homeowners are asking about as rates hold — see the Mortgage Demand Index.
About the data
This series is built from county-record and valuation data across 150,000+ properties whose owners previously inquired about home-loan products with RateZip. "Foreclosure-process events" are foreclosure filings and related events recorded against tracked homes; entering the process is not a completed foreclosure, and we make no claims about completed foreclosures. State figures compare the first half of 2025 with the first half of 2026 on the same per-10,000-tracked-homes basis, so a state's growth in the tracked set cannot masquerade as a rise in filings.
The figures describe the homes we track — properties whose owners at some point shopped for a home-loan product — not U.S. homeowners overall, and that skew matters: a tracked set built from home-loan shoppers naturally carries more mortgage activity than the housing stock at large. We publish percentages, rates per 10,000 tracked homes, and medians only.