
Many of us have been taking advantage of a bit of free time to increase our knowledge. I have personally completed 3 online classes and enjoyed every minute of each one. Hence the geek alert.
As a sort of paying it forward, I’m going to dedicate today’s blog on mortgage education to you, dear reader. That learning will mainly be in the form of Q&As answered with Infographics. Who is excited now??? All nerds, geeks and techno chart groupies, please raise your hand.
Here goes.
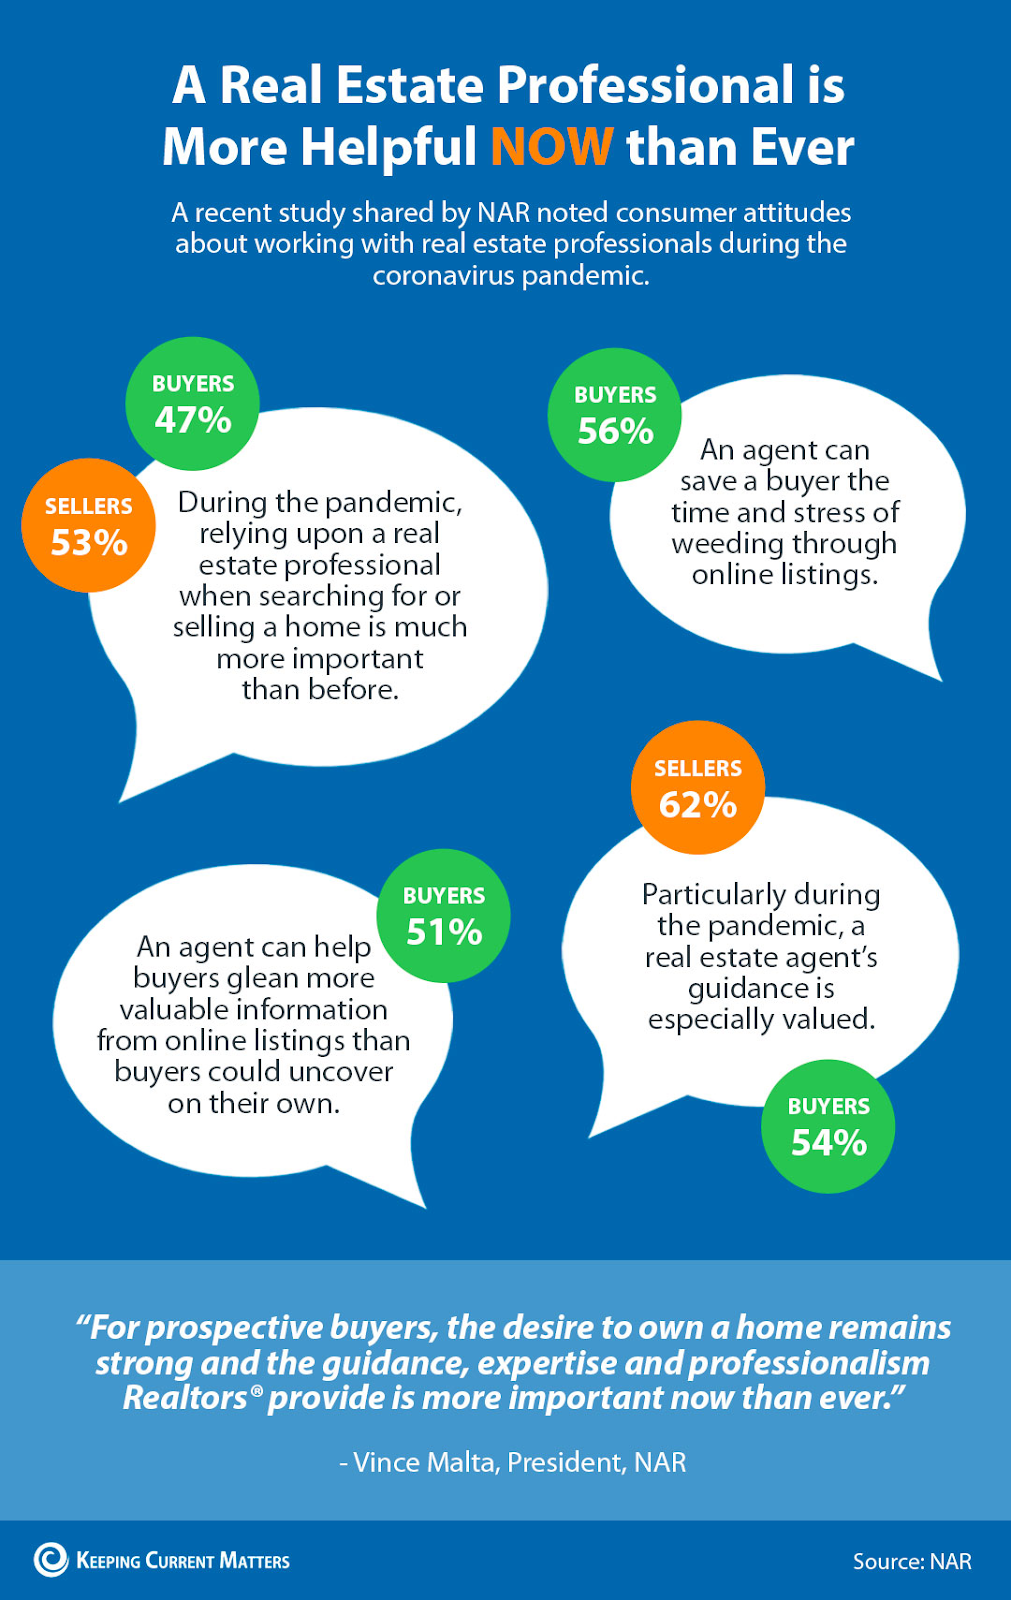
Why is a Realtor of value to you?
This reply was posted on Keepingcurrentmatters.com and is from the National Association of Realtors.
AND, just like that, it's already time for a digression. So soon? Yes!
If you are an aforementioned math, graph, techno nerd like me in the mortgage or real estate field, you simply MUST check out the “Research and Statistics” section of the NAR website. It is chock full of data and trends and pictures and factoids … It provides geeks like me with hours of fun.
For example, here’s 26 pages on 2020 Market Recovery. Here is a very tiny piece of the included Weekly Housing Market Monitor.
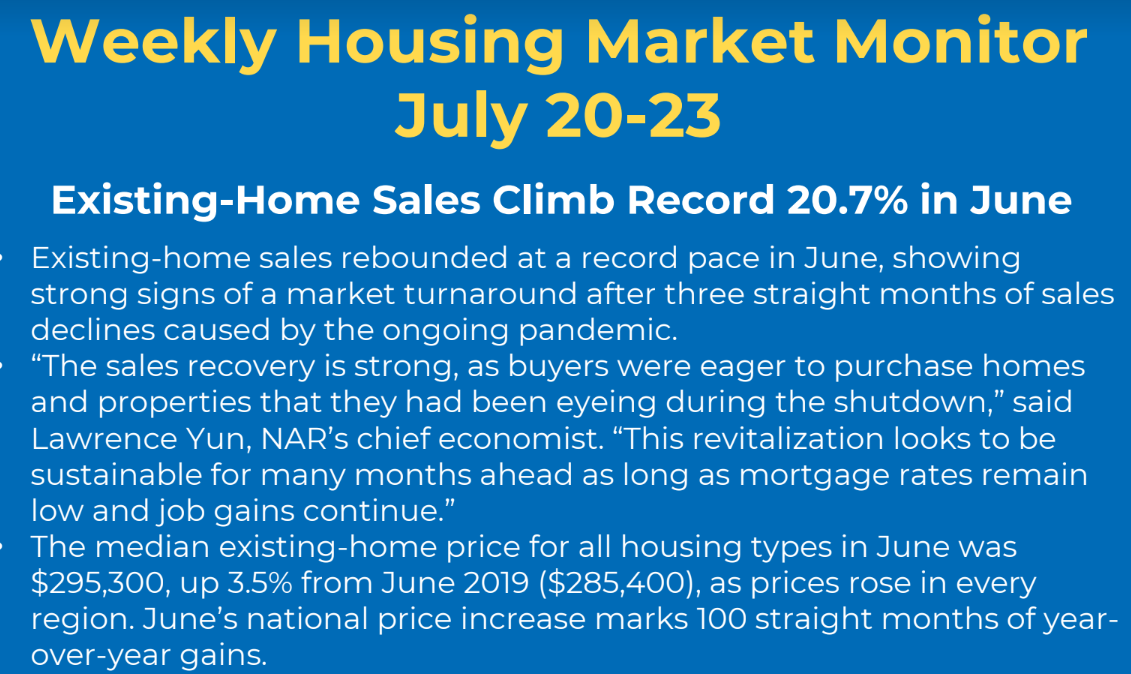
Kudos and gratitude to the group(s) at NAR who provide these analytics which entertain me for hours! Moving on …
Let’s keep the gratitude going as we tell Freddie Mac thanks for answering the question, “When WERE interest rates previously this low?”

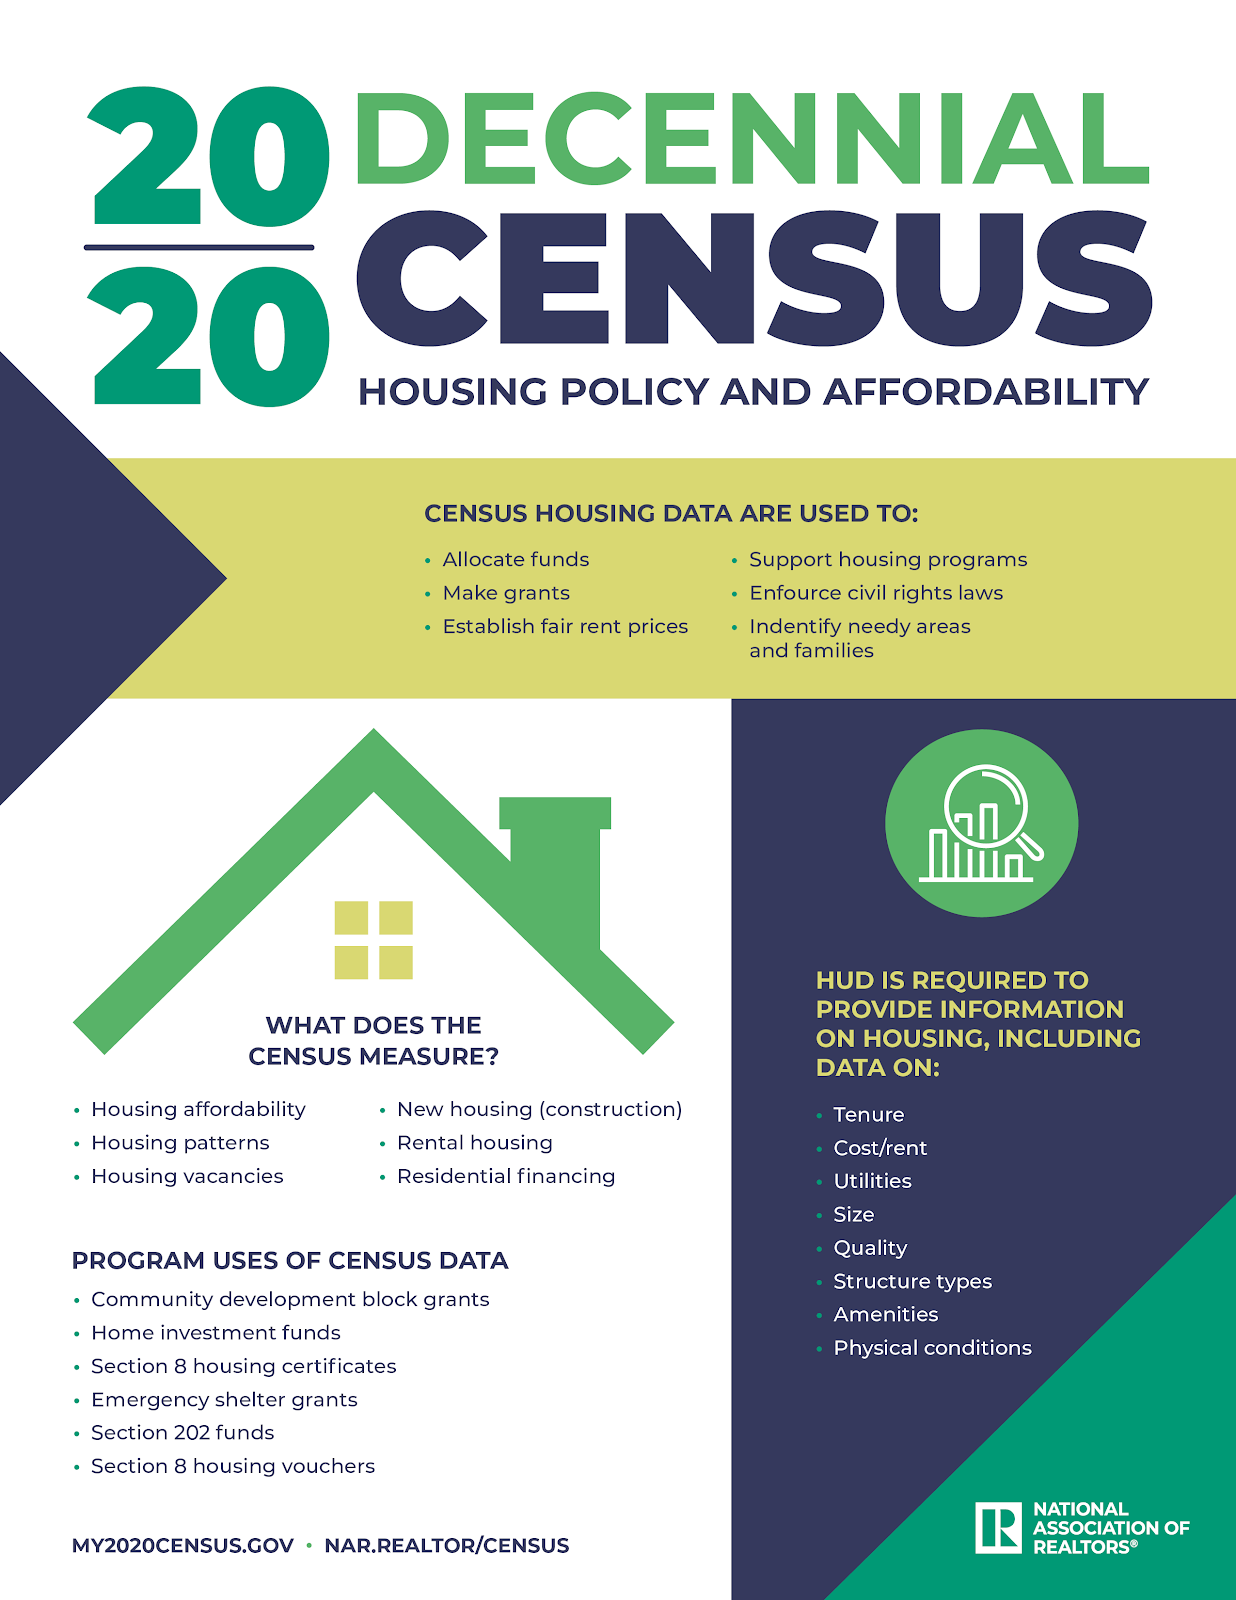
Jumping back to the NAR, let’s query, “What’s the funky new (to me) word we can use to describe 2020, which no one has seemed to mention in the midst of the pandemic?” Decennial! Added bonus--check out what HUD has to provide to the Census Bureau re: housing.
Is everyone as excited about these Infographics as I am? Come on, this is great stuff!!!
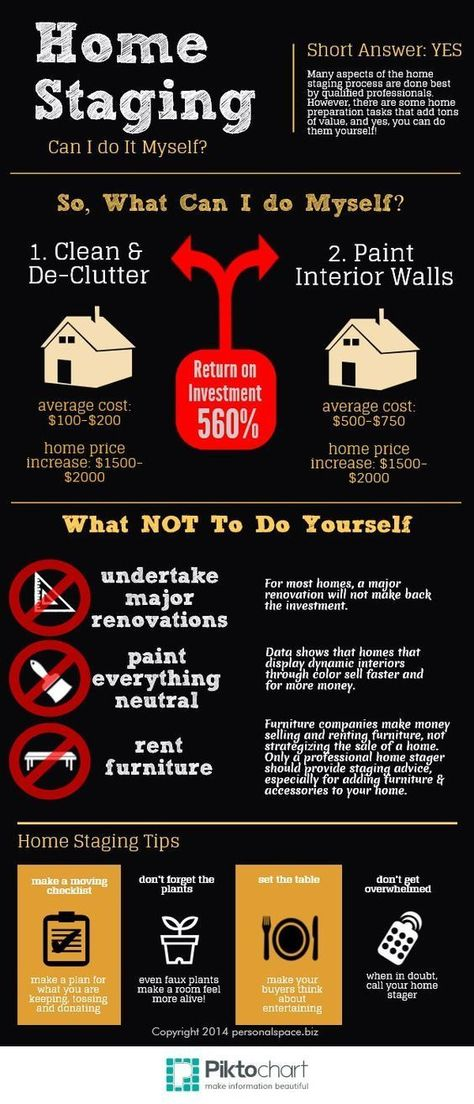
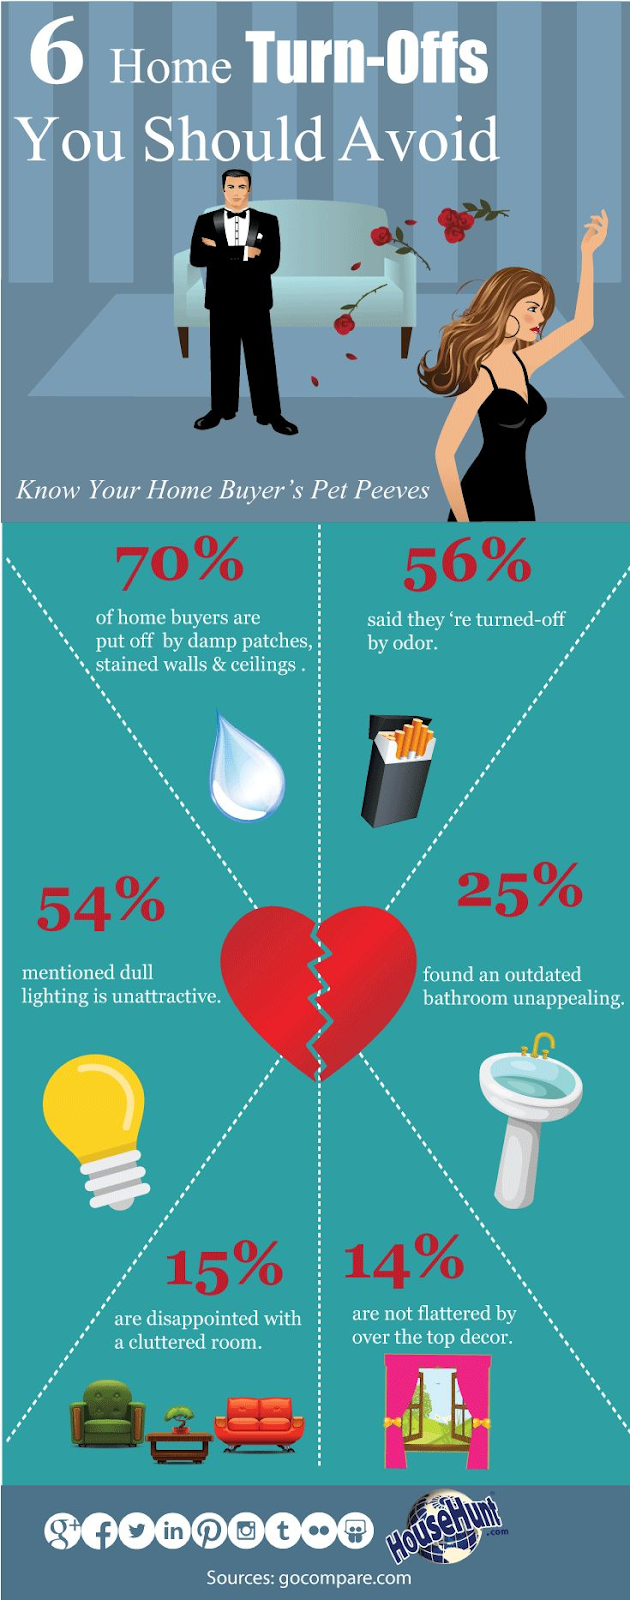
Next, we’ll destroy some myths related to home selling, specifically, “What Not to Do Yourself”? I am now soooo tempted to paint some of my walls red, or cobalt blue, or maybe even magenta!
Here’s more on that. Sellers, what turns off your potential buyers? It's sourced as being from gocompare.com. But I found it on this Jason Fox real estate page, which was awesome, even though it locked me on his page (UGH).
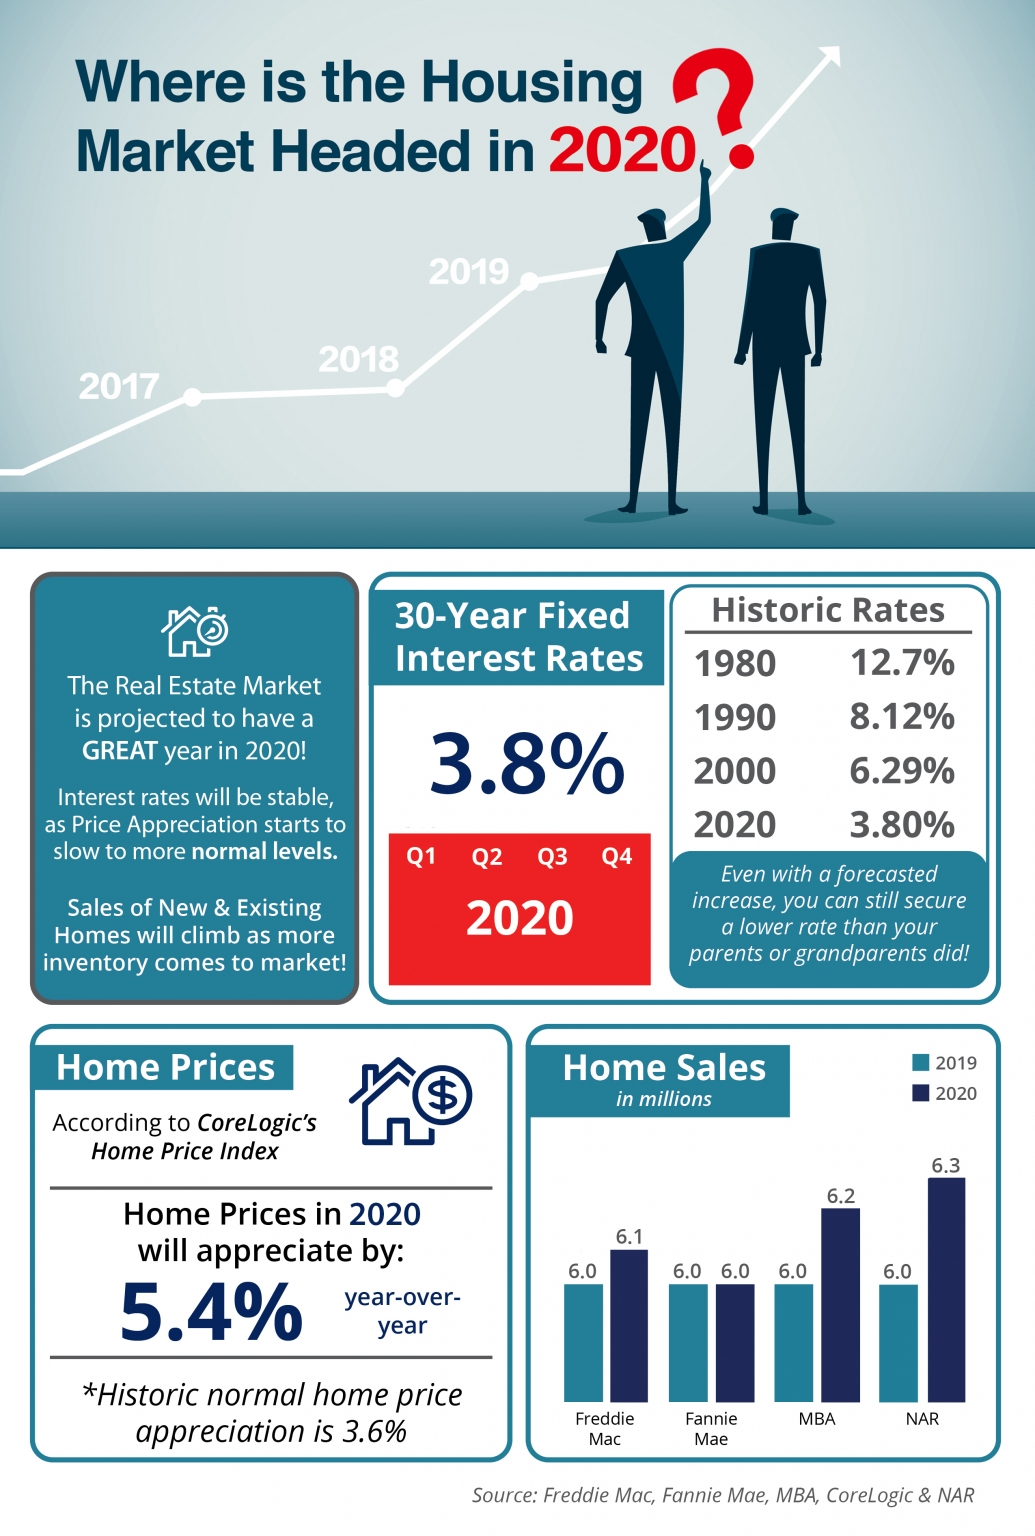
And if you had asked earlier this year, “What will the 2020 home market be like?”, check THIS out. Freddie Mac, Fannie Mae, the MBA, Core Logic, and the NAR all combined to create this gem posted on the RealEstateToolBox! It will be interesting to see how this compares to actual results after this year ends. And, unfortunately, they included the word, “normal”. 😭
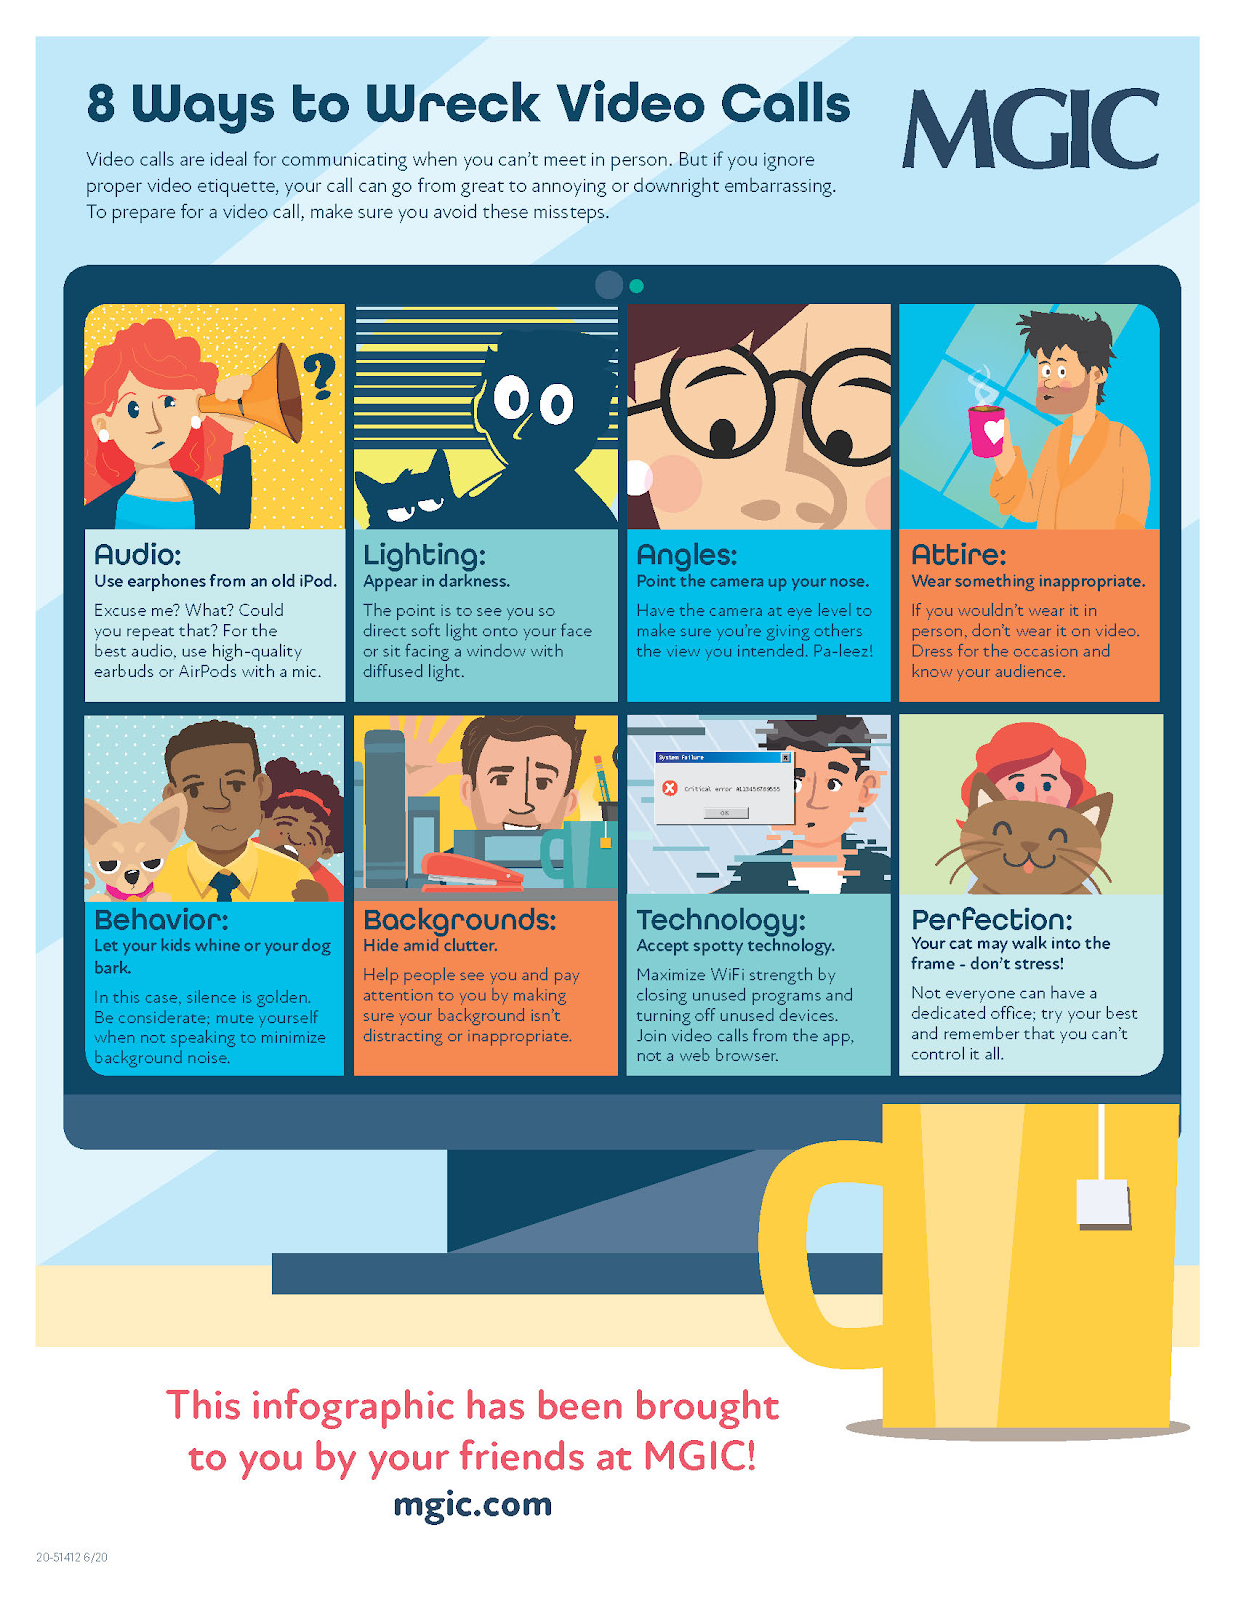
Keeping it current, our friends at MGIC posted a reply to, “How do I Zoom correctly?” in “8 Ways to Wreck Video Calls.” I’ve already passed that one on to my low-tech husband who is still Zooming from home. Wait, that didn’t sound right at all. Carification: he’s still on multiple Zoom calls per day while working from home.
Here comes a fun somewhat interactive Infographic. It’s filled with data and you get to click on some pictures to see specific numbers. Fortunately posted it and it’s called, “20+ Mortgage Statistics to Be Aware of in 2020”. Here’s a very teensy piece of the article:
- Percentage of homeowners with mortgages: 63.
- Number of homes sold in the United States each year: more than 6 million.
- Current American mortgage debt: $10.3 trillion.
- Portion of homes purchased with mortgages as opposed to cash: 78%.
- Total American homeowner equity: $15.1 trillion.
Click the link to answer, “What is the average new US mortgage balance? … or What percent of US homeowners have mortgages?” And it gets even better from there as you scroll down, in my humble opinion. 😆
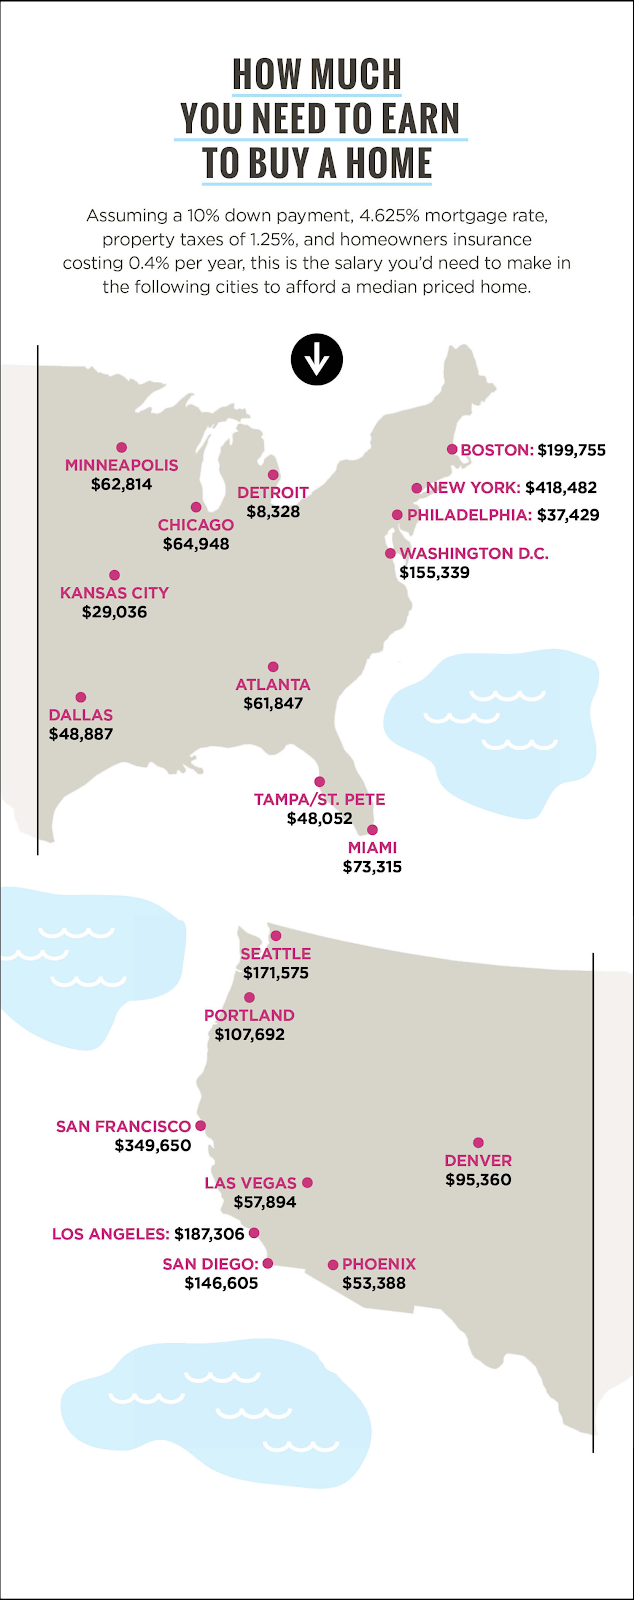
If you like this kind of marketing attention-grabber but have little talent in that arena, let’s next answer, “Who can make these for ME?” One suggestion might be AKZO Media and I’m sure there are many others that prepare similar infographics. Here are two recent creations:

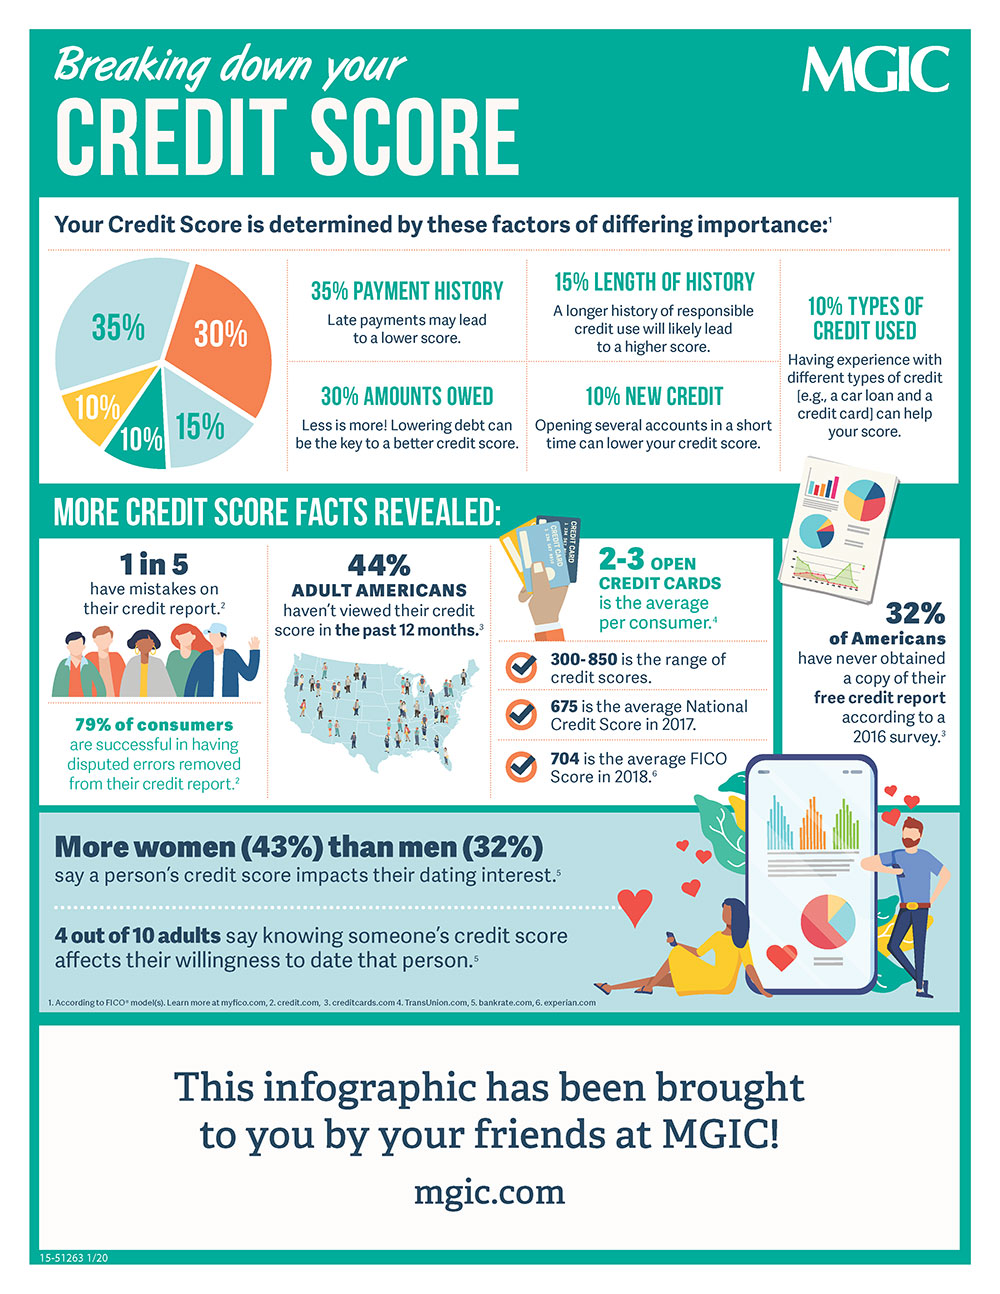
But what if you are a Mortgage Loan Officer just needing materials to wow your potential and/or existing customers? Not to worry, there are vendors for you too! For example, suppose your customer asks,”How is my credit score determined?”. While this was brought to us by MGIC again, it was posted on LoanOfficerHub.com! Check that site out for piles of other info, pictures, data charts, etc.
I’m having so much fun with this Q&A today! But if I am a member of a group of one, then I suppose I should start providing more universally accepted fun. Here goes.
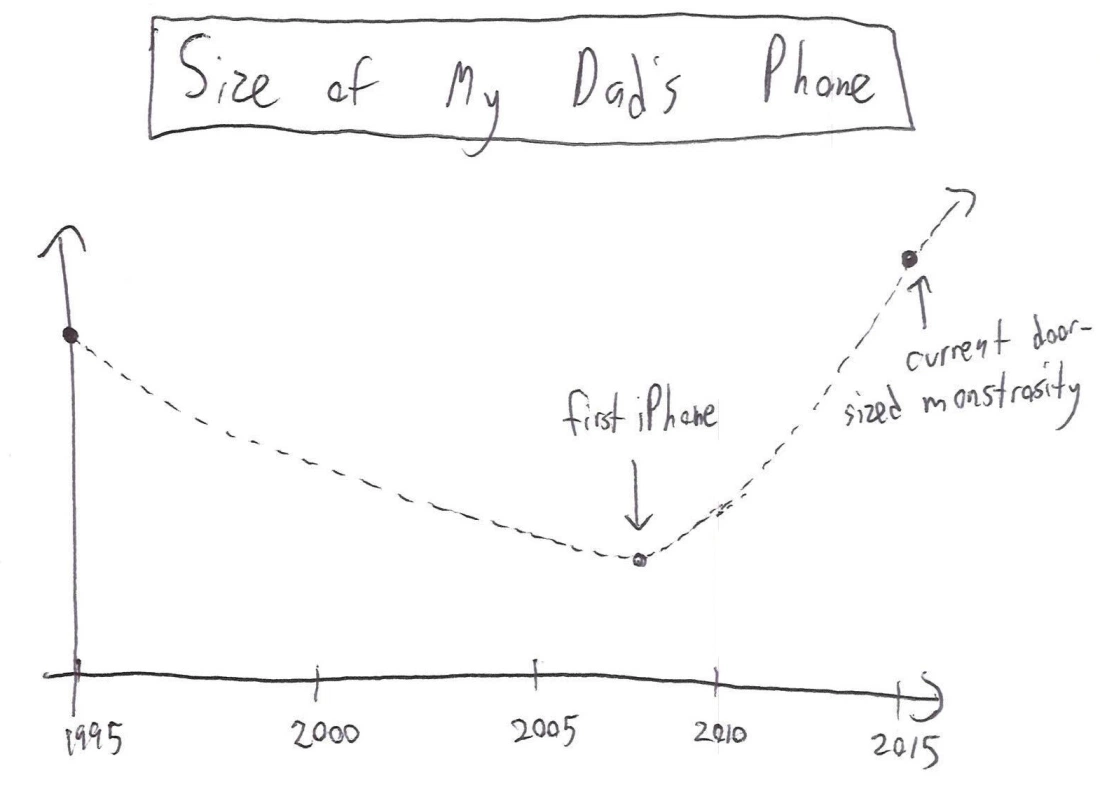
- I made a graph showing my past relationships. It has an ex-axis and a why-axis.
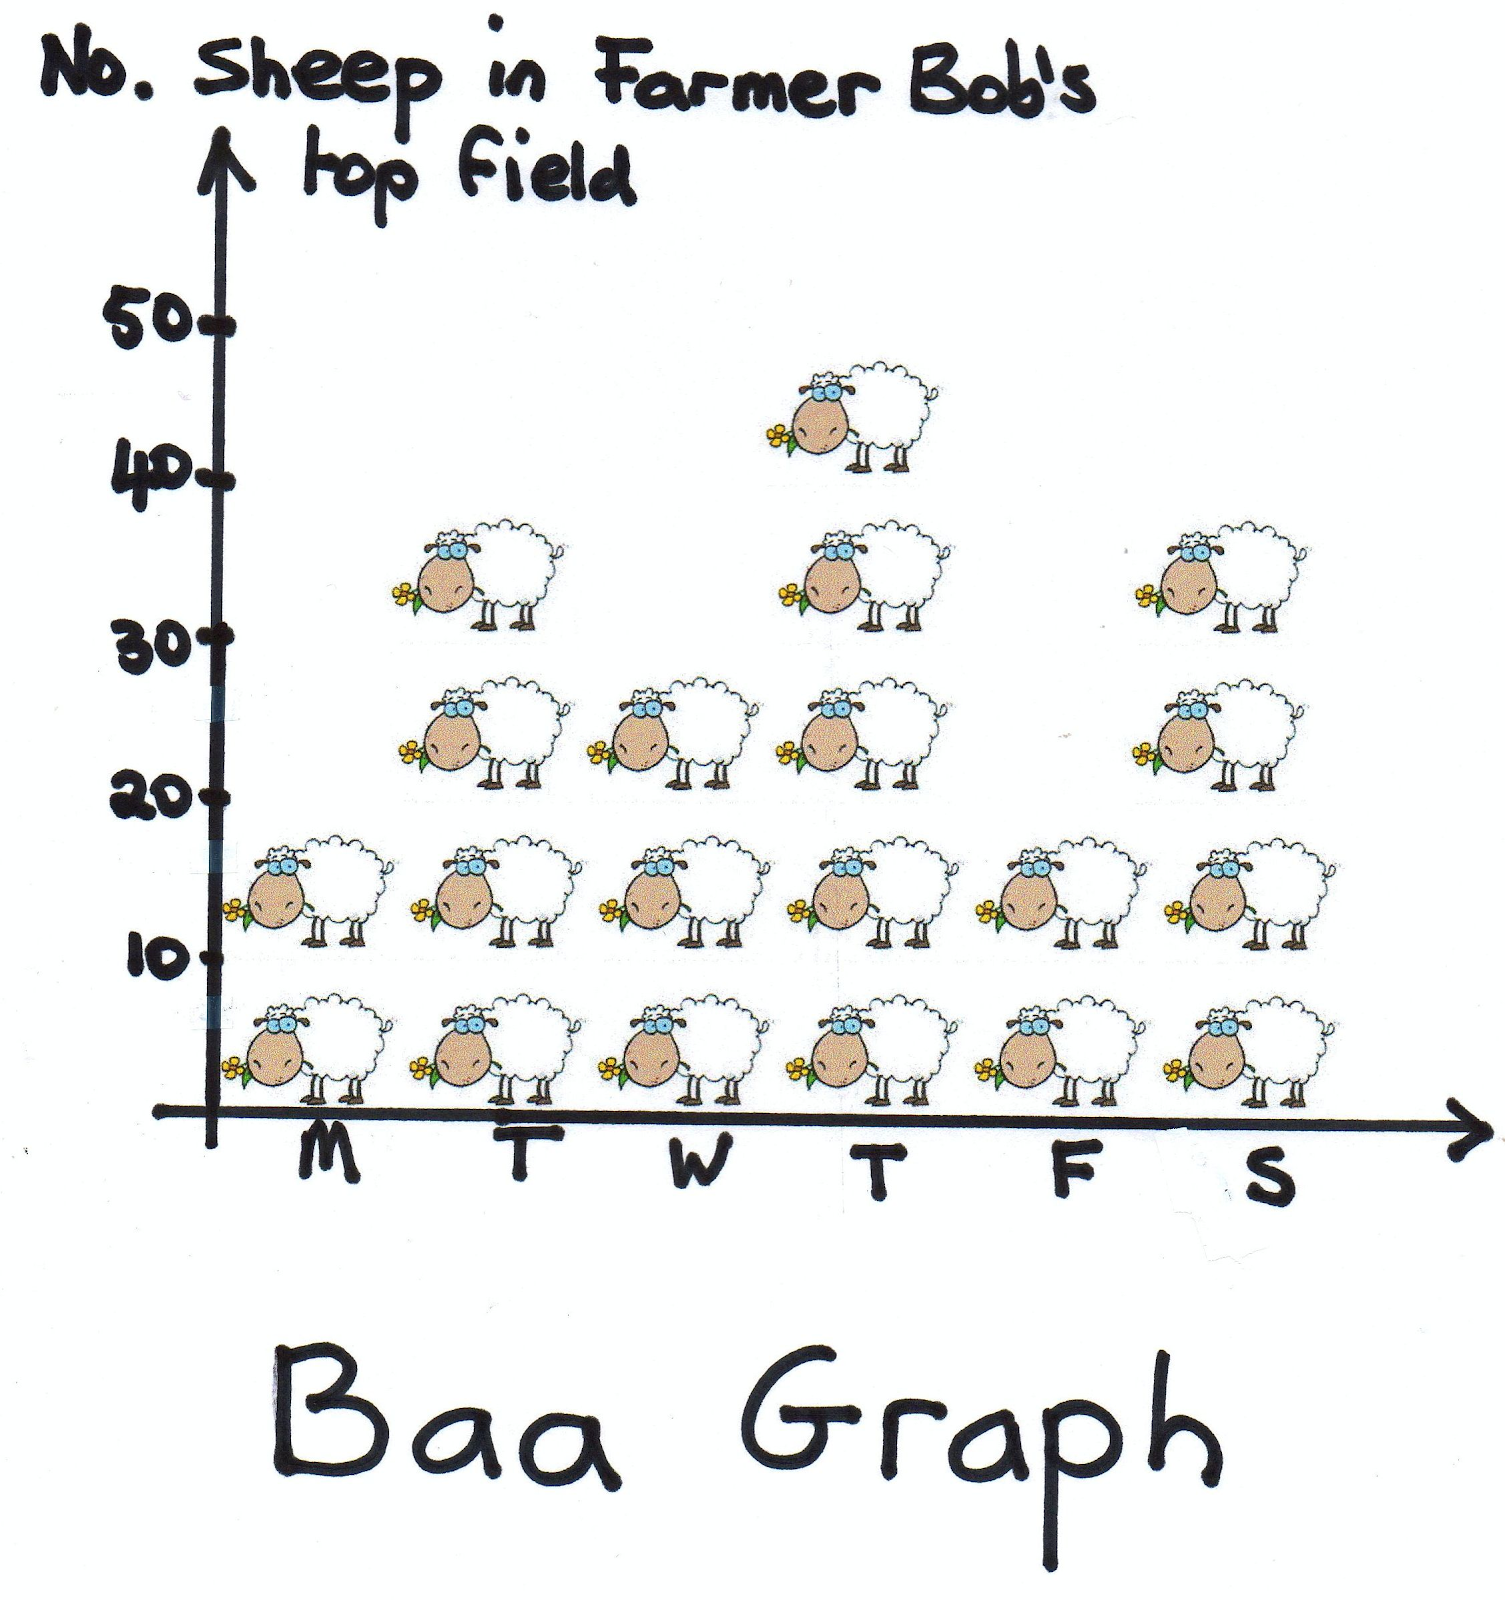
- I just watched a movie about graphs, and it was really disappointing. The plot was predictable, and the special f(x) was terrible.
- They’re all kinds of weird fetishes out there. Some people even get off on graphing. That's where I draw the line.
- A teacher was arrested getting on an airplane after his bag was searched and a protractor, a ruler, a calculator, and a book of graph paper were found. He was charged with possessing implements of math instruction.
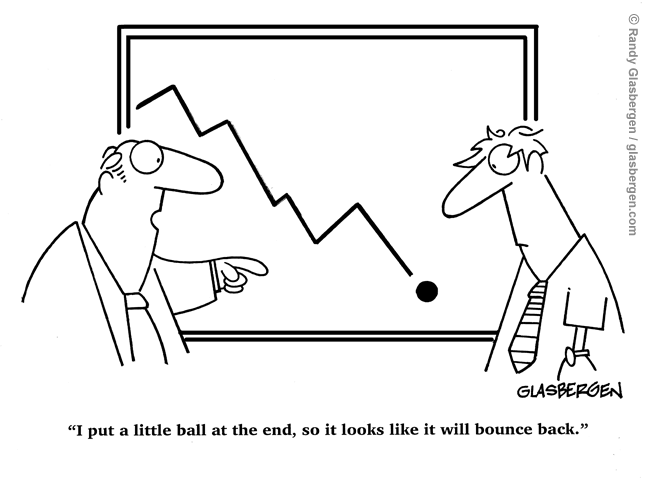
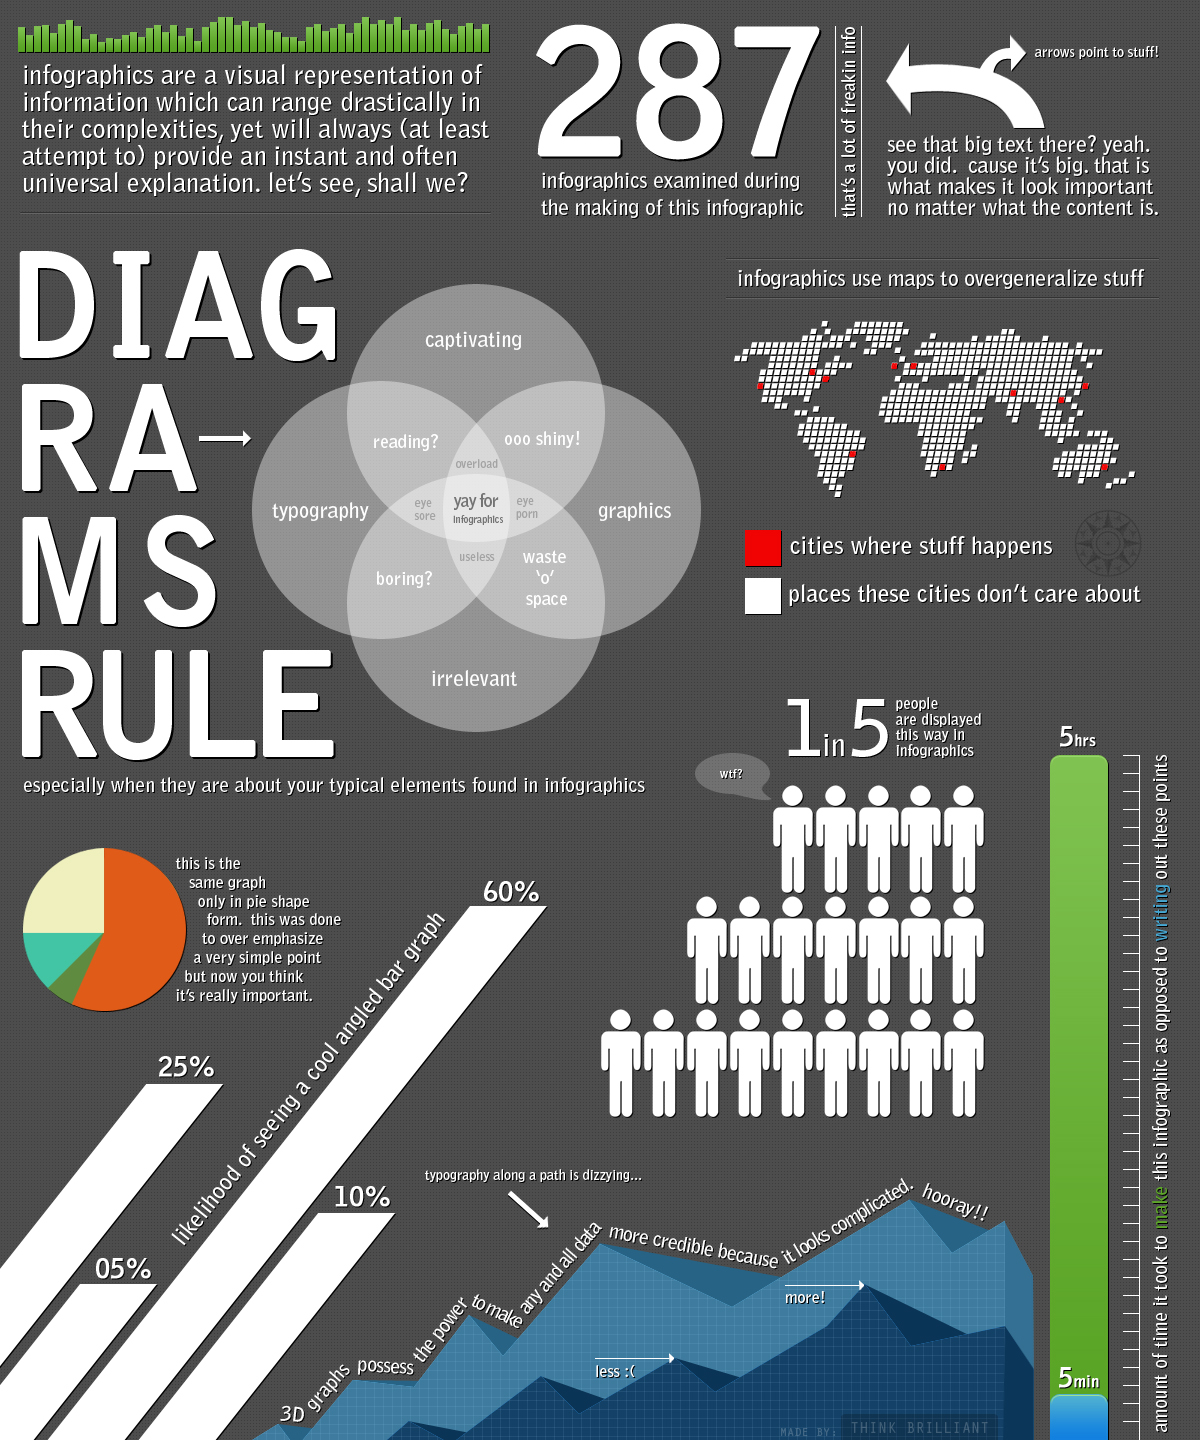
And for those warriors who powered through to the very end, here’s one of my favorite depictions of graphics from an old CareerBuilder.com ad. 😂